
An Analysis on the User Experience Implications of Username Formats for Recognition and Differentiation in Large Populations of Pseudonymous Individuals: Pre-Report
Published torsdag 11 september 2025 kl. på natten by Fyrine Holm, J Pau, MoonshineAddict, Sego, G, and AliveR
This pre-report outlines the motivation, design, some preliminary results, and the implications for our username recognition study. We describe effectiveness, reaction time, and recall across pseudonym formats.
- Author: Fyrine Holm, J Pau, MoonshineAddict, Sego, G, and AliveR
- Date: 17:30 2025-09-10 PST
- Summary: This pre-report outlines the motivation, design, some preliminary results, and the implications for our username recognition study. We describe effectiveness, reaction time, and recall across pseudonym formats.
Contents
ul> - 4.1 ShotRush"s Automatic Participant Pseudonyms
1 Disclaimer
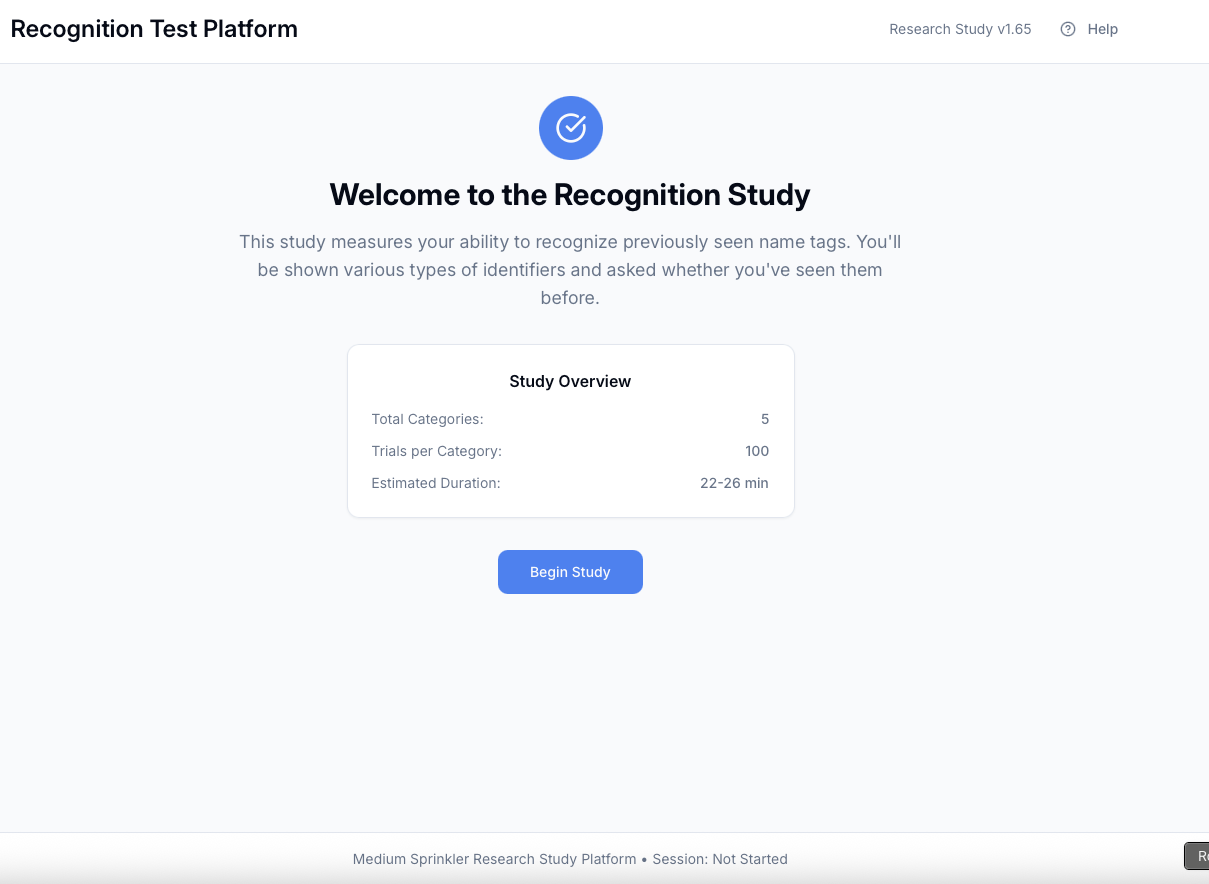
v2.0 of the study is live as of the publication of this pre-report! The reader is asked to partake in the study regardless of whether or not they have been involved with the study in the past, or ShotRush"s experiment. All submissions are highly valued and the basis of our coming report! The study platform is accessible from the link https://sprinkler-nametag-test.fyr.li
The main reason for the release of a pre-report before the study is finished gathering data is to make more people aware of the study, of which version 2 is going live simultaneously with this pre-report, which will hopefully convince more players to take v2.0 of the study and give us more data to work with on the final report. This pre-report is designed to be released prior to the completion of the final version of the study (and its accompanying report), and therefore we find it necessary to begin this document with a disclaimer that any conclusions one might be tempted to draw from the data in this pre-report are based on an inferior study methodology, and we advise patience until the final report is released. The contents of this pre-report are entirely preliminary to the final report and should not be taken as a substitute.
We have made the decision to exclude an abstract and conclusions section in this pre-report as our team has deemed it inappropriate to preempt the final report. We will refrain from drawing conclusions or interpreting the data that we have so far. We will instead focus on sharing our findings and analysis so far. This pre-report has been condensed to make it more easily digestible, as the extra details will be saved for the final report.
2 Plain Language Summary
This pre-report is being written partway through a series of studies undertaken by the Sprinkler Nametag Study research group. The pre-report details an ongoing experiment and investigation within the vanishingly narrow intersection of leading research in the field of User Experience and Interface (UX/UI) Design and ShotRush"s Minecraft Civilization experiment (testing Joyful"s theory of specialization, a digital sociology theory wholly unrelated to UX/UI design).
We seek to compare how different styles of username formatting and presentation could affect the ability of users to differentiate and recognize a single user"s username in an ever-growing pool of usernames that the given user has been exposed to.
Note: Joyful has recently changed his name to Joyfuul (with two "u"s) for unknown reasons. Despite this, the research community continues to refer to his theory under the name he published this theory under, Joyful. We chose to follow this convention.
3 Public Significance Statement
This research is significant because it advances and promotes accessibility within communities of pseudonymous individuals, especially individuals with poor recall, or language/memory disorders such as dyslexia or Parkinson"s disease. This research also benefits the Everyman, because our research looked to determine the systems that worked better or worse for everyone. If applied, this research may increase the amount of active social connections that someone is able to have in a pseudonymous environment, allowing for more deeply connected communities with wider engagement.
4 Background
The inspiration for this study (and indeed even the research team backing it) was the wealth of discontent shared by many participants about the username system. Although every participant seemed to have their own, unique suggestion for resolution (and perhaps distaste for any rival suggestion), nearly all of these suggestions varied wildly. We were made aware of this situation and we determined that it had been established that the current system may be inadequate, but simultaneously that there was no consensus on what the proper replacement would be. The environment that created this situation is worth briefly covering, in order to understand how so many participants could be similarly discontented yet so disjointed and divided as for a replacement.
4.1 ShotRush"s Automatic Participant Pseudonyms
In ShotRush"s ongoing digital sociology experiment, they deploy an iterative trial system. In these trials, the design of the pseudonym system was a simple, inoffensive, and logical format that upon cursory inspection does not invite criticism or show any obvious fault.
4.1.1 Rationale
ShotRush"s experiment, like all experiments had confounding variables to control for. One of these was, unusually, the participants themselves. In the first trials of ShotRush"s experiment, the total amount of players in attendance was few, and they had the ability to converse among themselves prior to the trials taking place, and even in-between sessions of an going trial. As a sociology experiment, the risk of these external interactions contaminating the results was unacceptably high (ShotRush, 2025a). ShotRush also explained that "because of the tendency for participants to gravitate towards recognizable personalities or content creators, all participants will remain anonymous during the trials" (ShotRush, 2025a). These reasons were the basis for the need to create an automated system for assigning pseudonyms to participants.
4.1.2 Design
The ShotRush pseudonym system has two iterations. In the zeroth trial, pseudonyms were rendered in the format
RoleXYZHealer358Guardsman904Farmer204This system was redesigned following the zeroth trial, to prevent names from changing when participants re-skill themselves. In subsequent trials, the new system design rendered pseudonyms in the format
Participant_XYZParticipant_841Participant_920Participant_77
4.1.3 Expected usage
In an interview with a member of the ShotRush team, they expressed that the intended purpose for their system design were initially to express the participant"s role, and later not even that. The intent, as explained, was not for participants to use their assigned numbers as designations or monikers, but for participants to instead use eachother"s avatar, actions, and mannerisms to come up with new names unlinked to external or real life baggage that could be used to deanonymize participants. The unwieldiness and indistinguishability of the provided pseudonyms was designed to intentionally incentive participants to generate their own working names in the moment for eachother.
4.1.4 Actual usage
In practice, through the course of several trials and sessions, participants relied very heavily on the numeric identifiers, using them as names. In one recorded case, over the span of 93 seconds, these unwieldy numeric identifiers were verbally uttered at least 18 times. Here is a transcript of this encounter:
Transcript of a 93-second interaction from ShotRush"s Trial 0 (KrazyKTV, 2025, 9:32-11:05):
"Ninety-five? Ninety-five? Ninety-five?"
"..."
"Eight-eight-four? Let me go. Eight-eight-four, let me go."
"Why is everybody..."
"Eight-eight-four? Let me go."
"Eighty-four, stop. Eight-eight-four, stop."
"Get Seven-fifty. Seven-fifty. Seven-fifty."
"Eighty-four is doing this. Eighty-four is doing this."
"Kill the dogs."
"Which person is the- Which person is the heretic?"
"Everybody"s attacking."
"It"s Seven-fifty. Seven-fifty is attacking."
"Seven-fifty is attacking. Seven-fifty. I think this out."
"..."
"Is this him?"
"Get this. That"s him. Oh, not me. Nine-zero-nine."
This transcription shows the strain on communication that the reliance on these identifiers adds. Upon further investigation, barely any emergent names were used in Trial 0, the only two examples confirmed to have been widely used were
President RedFayman4.2 Barriers to replacing usernames in UX/UI Design
Usernames are one of the most critically important features of internet discourse and interaction between users. Despite this, their nature and presentation is rarely discussed, due in large part to the fact that very little has changed in the design and structure of usernames since the inception of the World Wide Web.
Usernames have, from that inception, been unique string identifiers chosen by the user, typically constrained to the Latin alphabet and some maximum permissible length. While plenty have considered the impacts of different usernames from the perspective of the user choosing their own name, across the entire history of online usernames, only a few changes have come up over time. One notable change made necessary by the growth of the internet is the inception of discriminators, which allow multiple users to occupy the same string by adding a numeric component, preventing common terms from becoming "taken". Aside from this small addition which is still not widely adopted, there has never been a pressing need for the design of usernames to fundamentally change.
5 Sprinkler Nametag Study
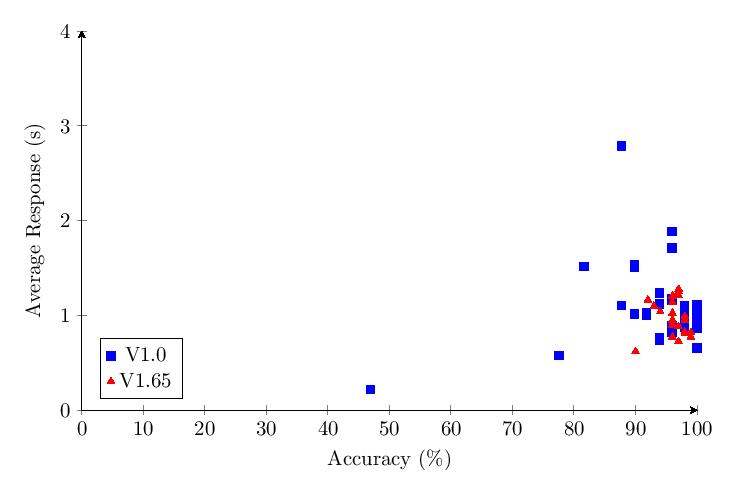
The Sprinkler Nametag Study, namesake of the research team authoring this pre-report, is an online research study platform website used to gather data on how well participants can recognize and tell apart different generations using the same format of usernames. Versions 1.0 and 1.65 of this test were conducted after September 4 and September 6, 2025, respectively.
This study was fully funded by the Sprinkler Nametag Research Group and sponsored by Fyrine Holm, one of the authors of this pre-report.
5.1 Methodology and Design
This study presupposed that the primary issue with the ShotRush pseudonym system was the amount of pseudonyms generated by the system that could be differentiated, recognized, and remembered by the average player. Versions 1.0 and 1.65 only tested short-term memory, not long term memory. The study also didn"t shuffle the order of category presentation per session.
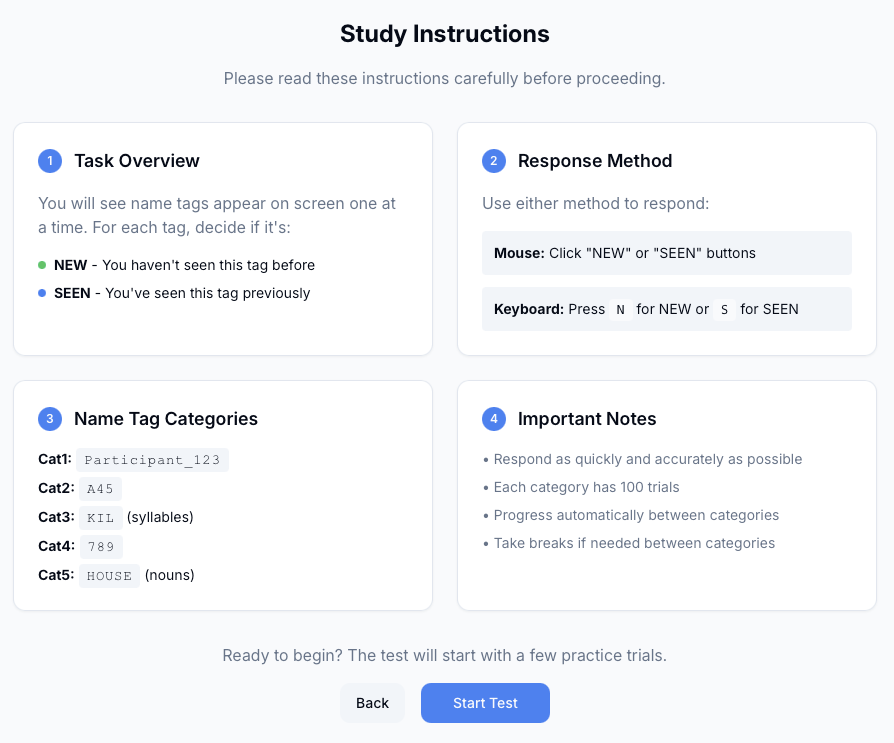
5.2 Categories
For our study, we chose to track the following categories of pseudonym formats for analysis. These categories were used for all 1.X versions of the study.
Participant_XXXParticipant_841LXXG45SYLLABLEZAGXXX841NOUNHOUSEThese categories will be referred to be their numbers for the remainder of this pre-report. The reader is advised to remember their order.
5.3 v1.0 Set-up and Study Results
The study was set-up in a hurry on September 4, 2025 and immediately went public to start gathering data. This was version 1.0, evaluating the 5 original categories. Version 1.0 tracked users on their average, max, and min response time per category as well as percentage accuracy across 49 trials per category per user (the user was presented with 50 trials per category, but due to a software bug on the client, the first response to each category was not recorded properly). This version of the study has no security measures to prevent from intentional deception by participants. Due to the fact that 1.0 did not track the individual series of accuracy, only the average accuracy, as well as the aggregate stats for response times but not the individual response time per test, we gathered less data from v1.0 than v1.65 per user.
Additionally, in the first version of the test, users were presented with no interstitial screen in between the testing categories to reduce test fatigue, while in v1.65 there is a new interstitial screen in between categories that offers users a rest. This means that we could expect the results of the data gathered from v1.0 of the test to be tainted by test fatigue.
This 1.0 version of the test received 41 responses that were reviewed, analyzed, and those 40 responses were charted in this pre-review to demonstrate their patterns. (After careful review of the responses to version 1.0 of the test, we removed one result from the final analysis on heavy suspicion of tampering due to wildly unreasonable values that deviated sharply from the other responses by orders of magnitude.)
v1.0 Table of Average Scores:
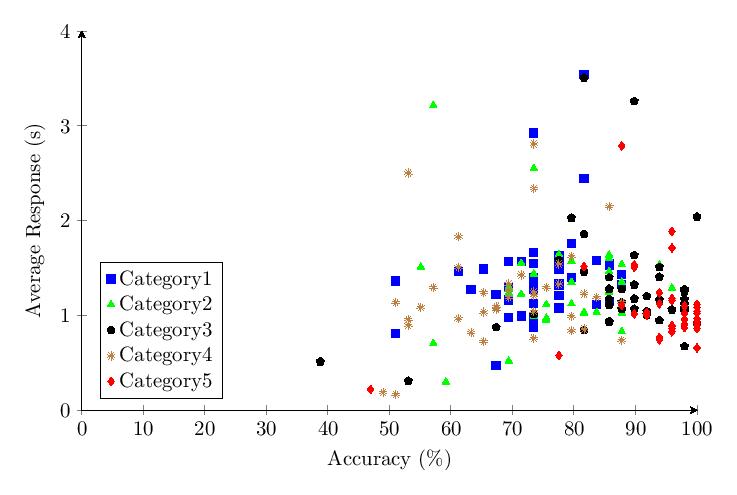
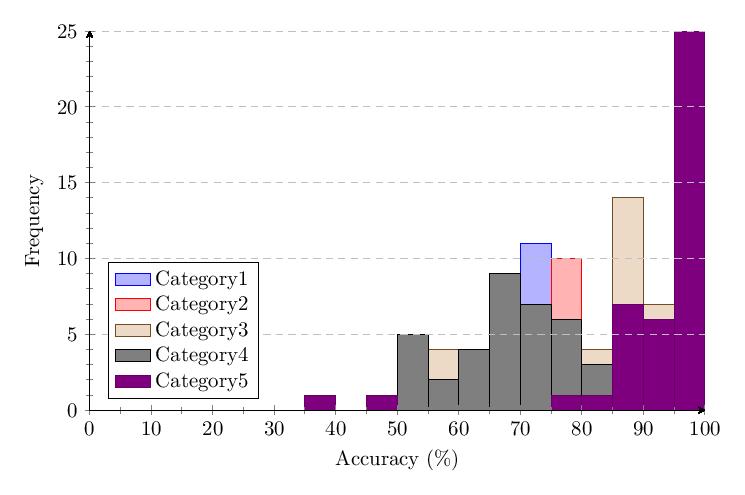
5.3.1 Category 1 Data
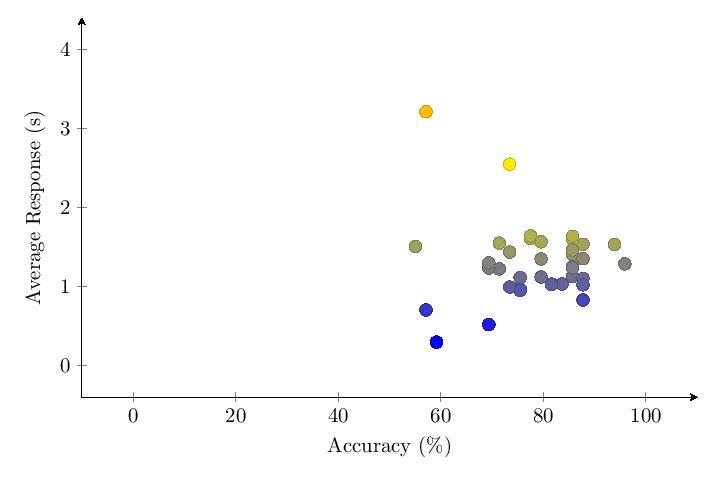
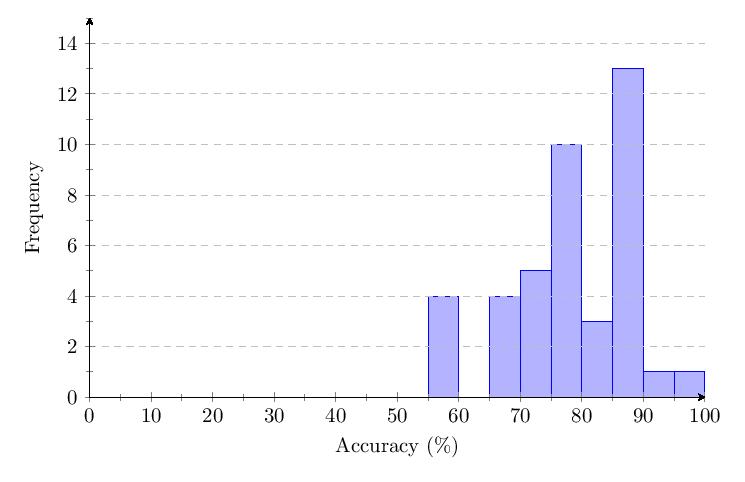
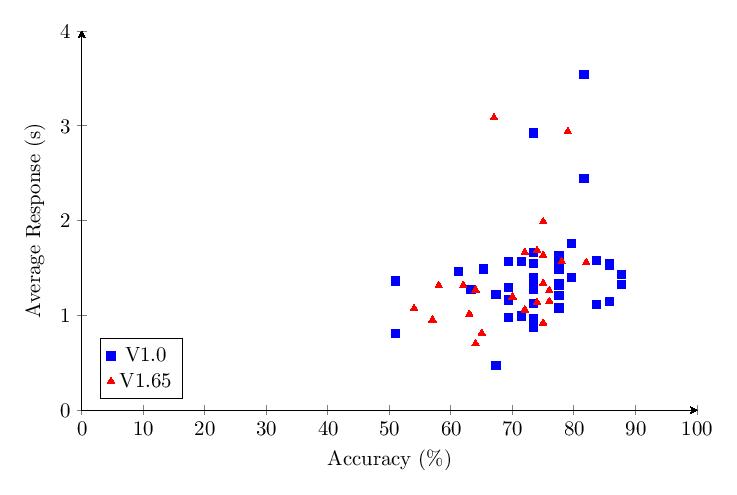
Scores for Category 1 averaged 74.3%. Most scores clump around 60-85% and response times around 1-2 seconds. The distribution of scores by intervals of 5% shows a peak of 13 scores around 70-75%.
5.3.2 Category 2 Data
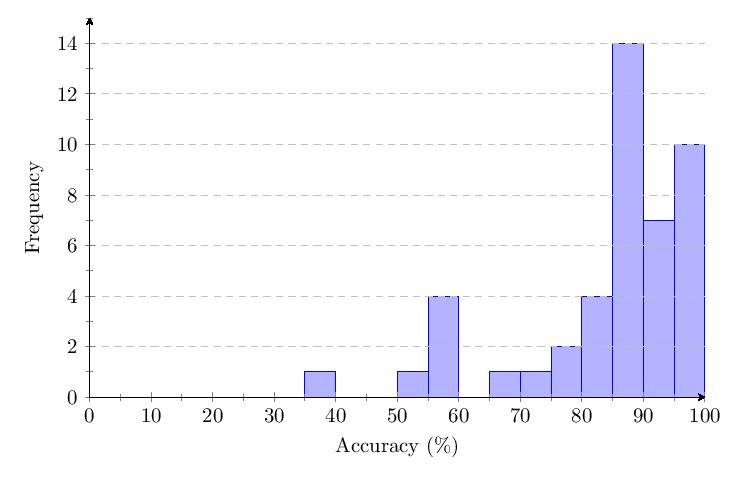
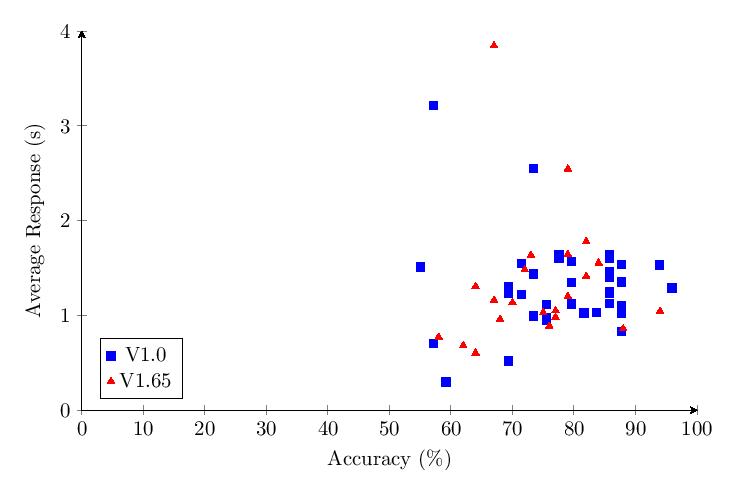
Scores for Category 2 averaged 78%. Most scores clump around 75-85% and response times around 1-2 seconds. The score distribution shows a primary peak with 14 scores at 85-90%.
5.3.3 Category 3 Data
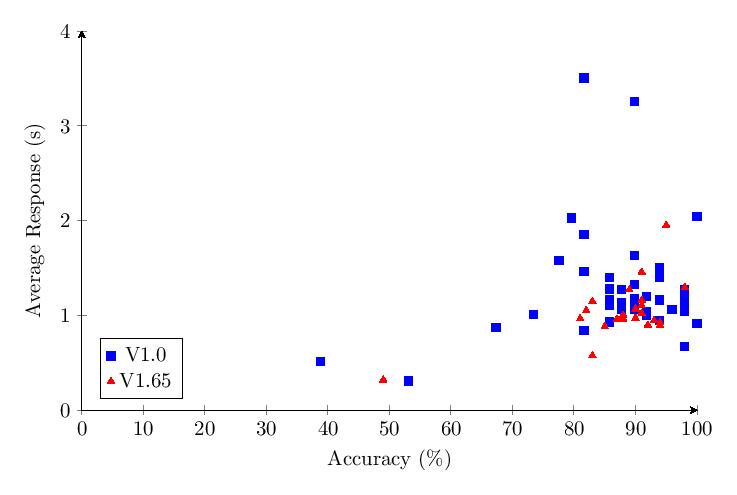
Scores for Category 3 averaged 87%. Most scores clump around 80-100% and response times around 1-1.5 seconds. The score distribution shows a primary peak with 14 scores at 85-90%.
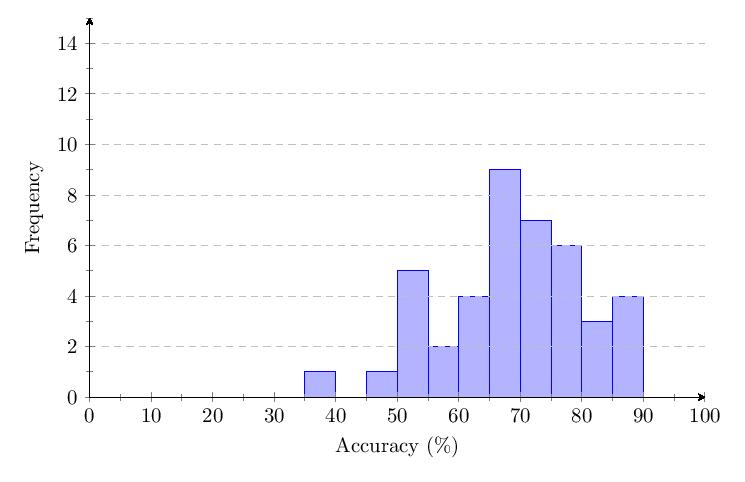
5.3.4 Category 4 Data
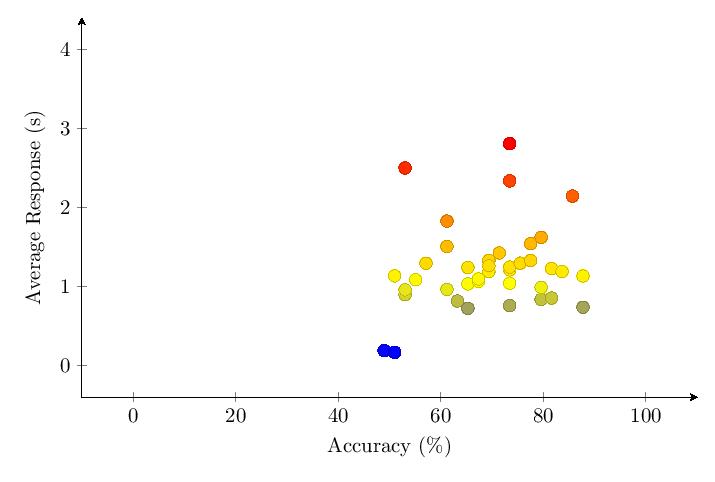
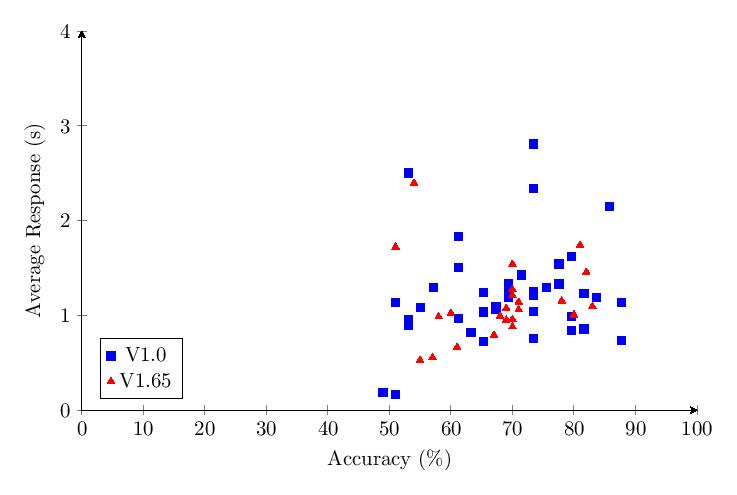
Scores for Category 4 averaged 69.5%. Most scores clump around 50-90% and response times around 1 second. The score distribution shows a primary peak with 9 scores at 65-70%.
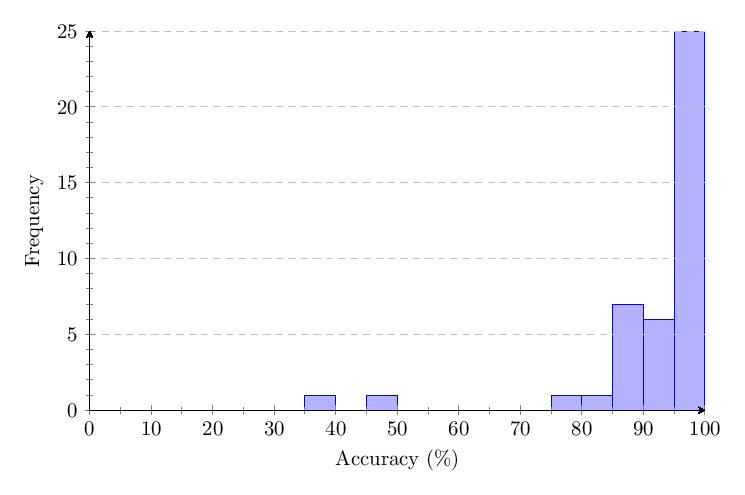
5.3.5 Category 5 Data
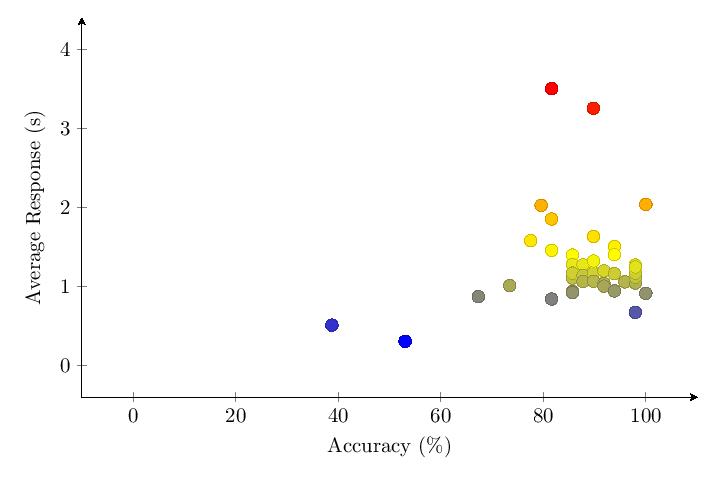
Scores for Category 5 averaged 93.6%. Most scores clump around 90-100% and response times around 1 second. The score distribution shows a primary peak with 25 scores at 95-100%.
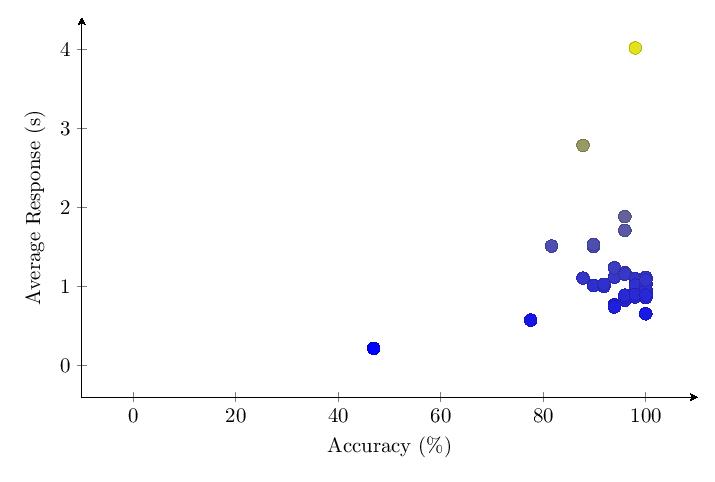
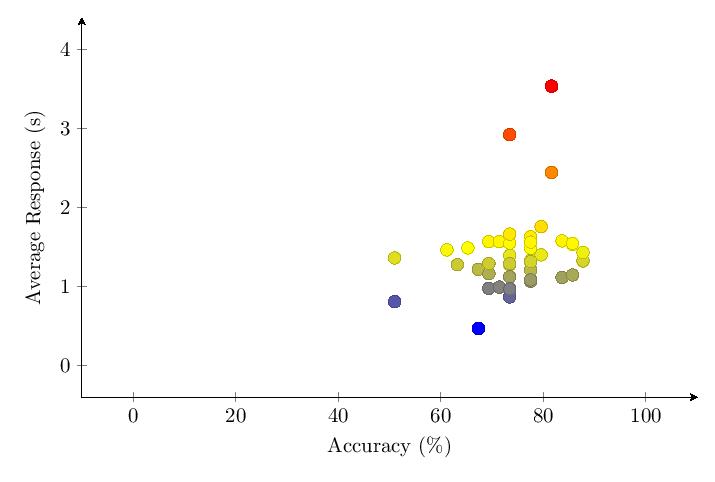
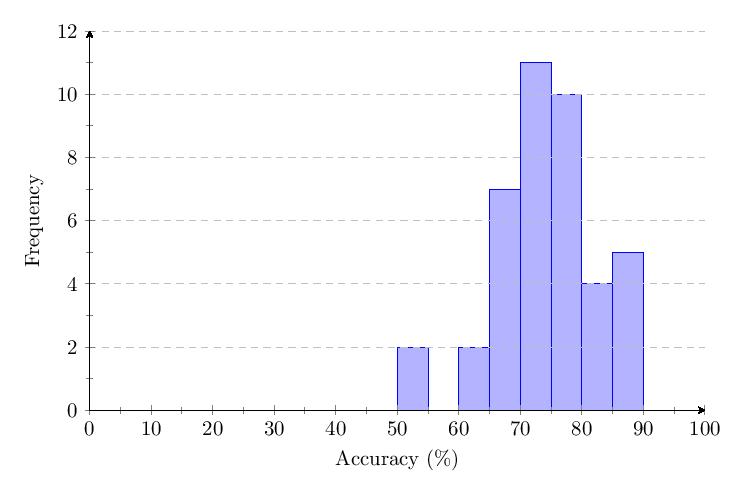
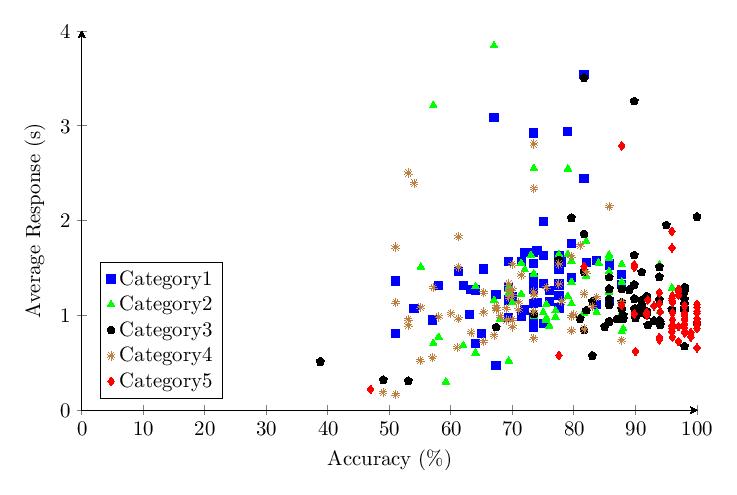
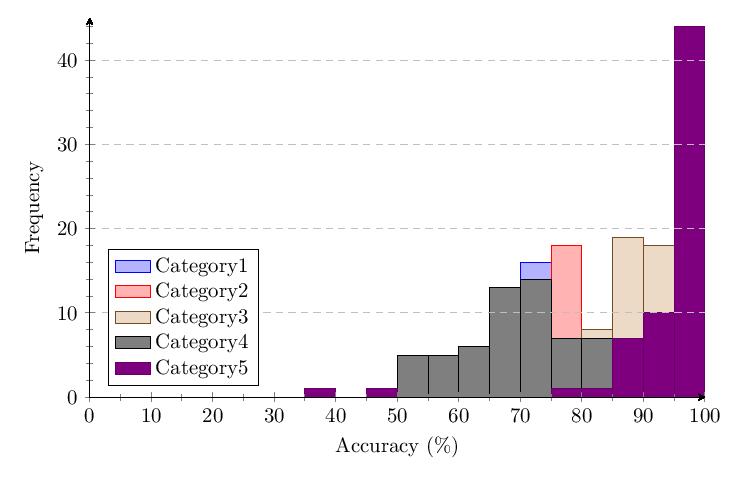
5.3.6 Comparing Categories
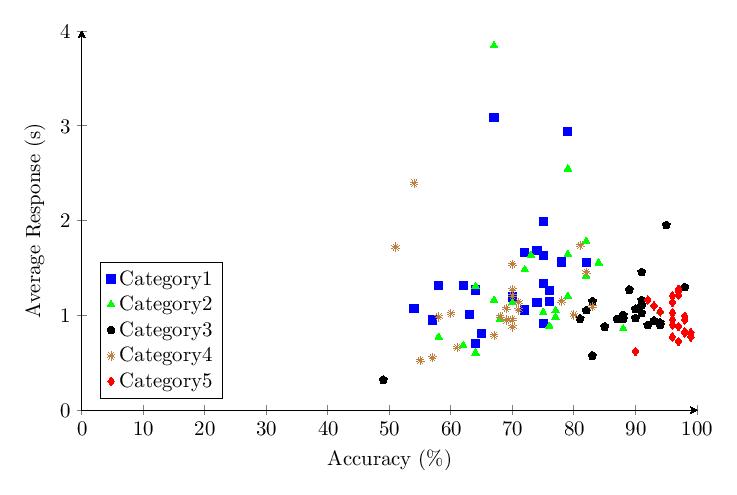
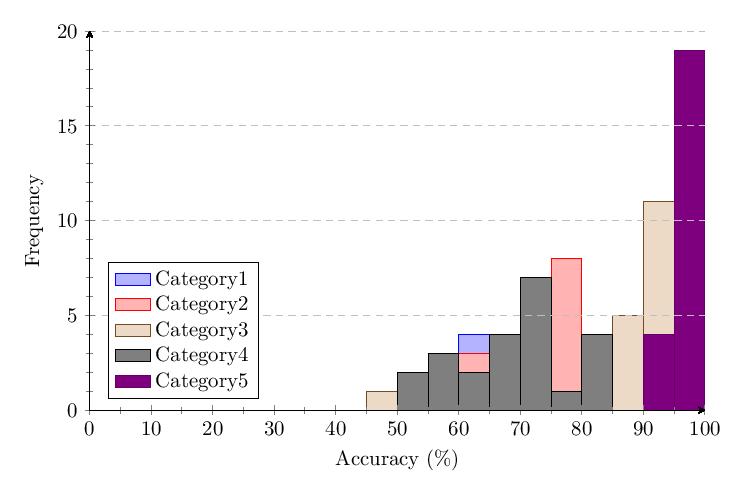
The scatter plot and histogram comparing results of the five tested categories in v1.0 show clear differentiation between category performance, with Category 5 (nouns) performing best and Category 4 (pure numbers) performing worst.
5.4 v1.65 Methodological Changes and Study Results
In contrast to the first version of the test, version 1.65 included an interstitial screen in-between the testing categories to reduce testing fatigue. The trials gathered per category was also doubled from 50 to 100. This means that we suspect the data from v1.65 to be higher quality. However, due to its increased length and a reduced marketing effort, only 28 responses were received.
Additionally, new data was collected from participants in this iteration. Specifically, this included data on the scores and response times by individual question, rather than the just the overall score of v1.0.
v1.65 Table of Average Scores:
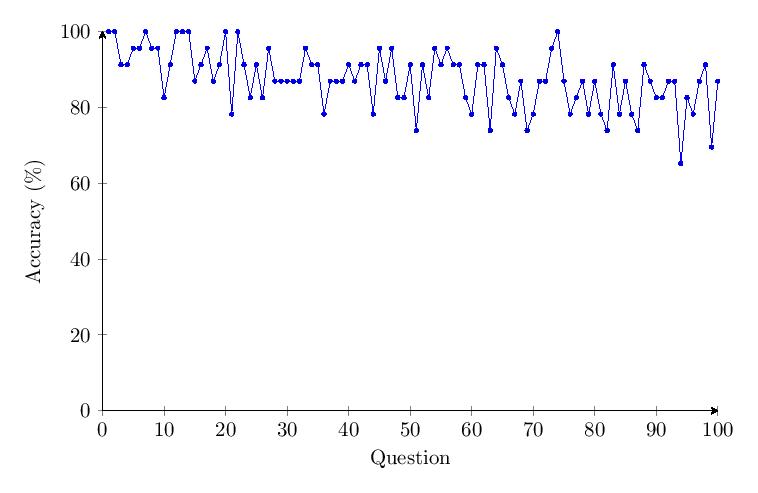
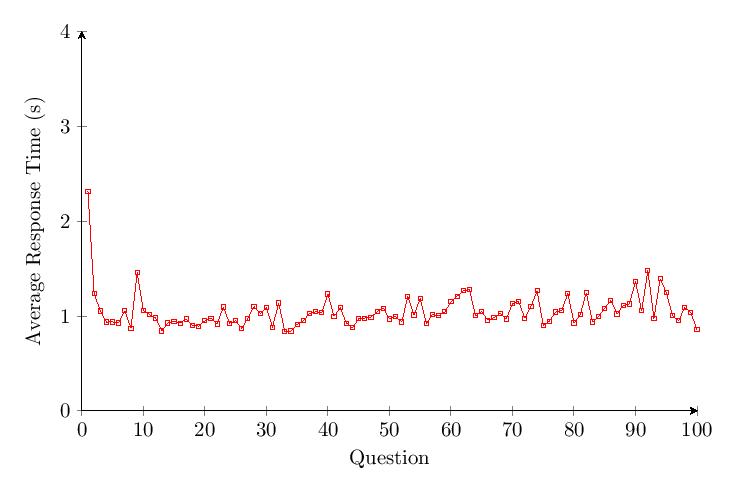
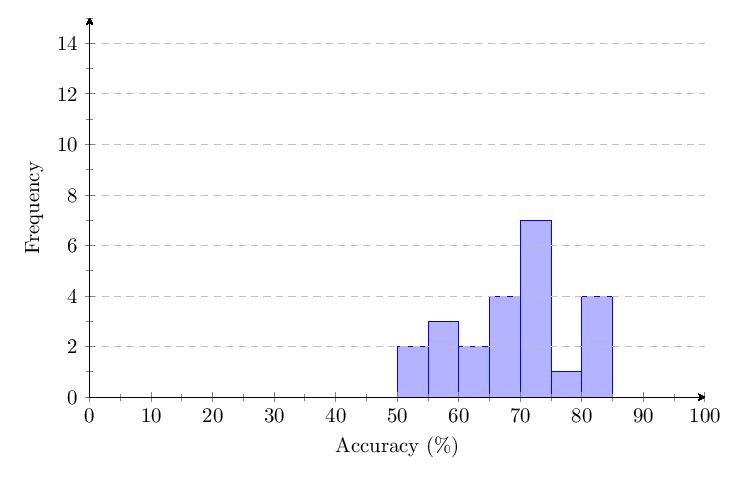
5.4.1 Category 1 Data
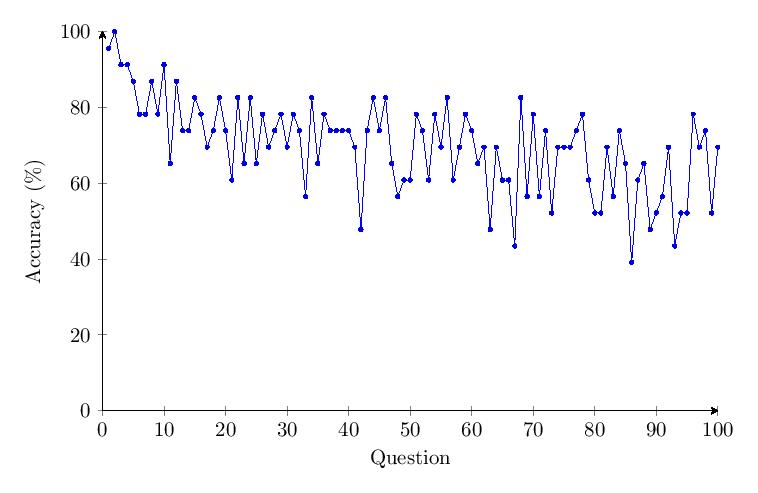
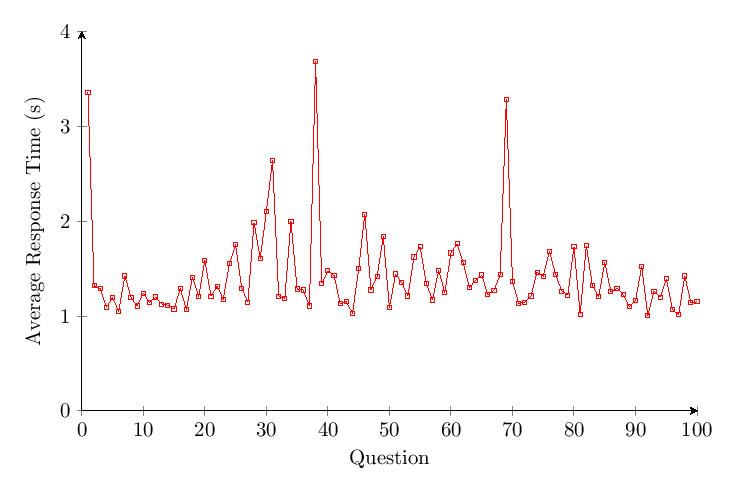
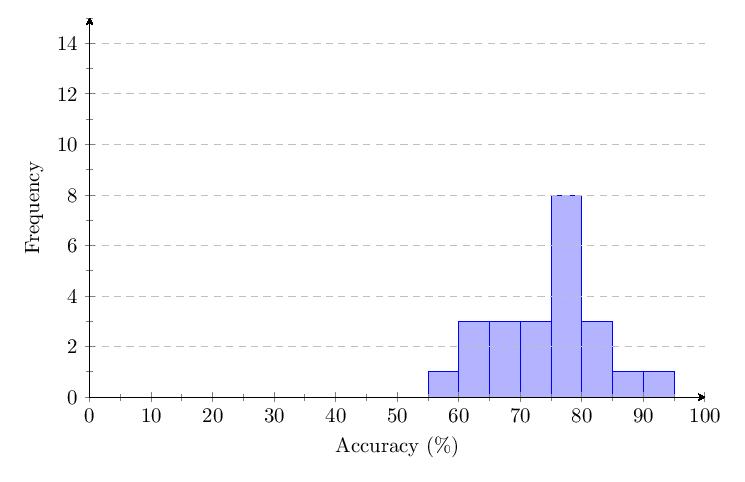
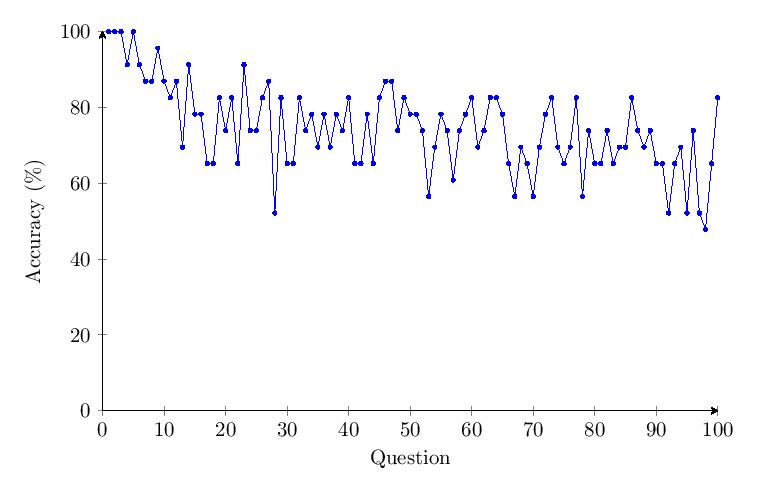
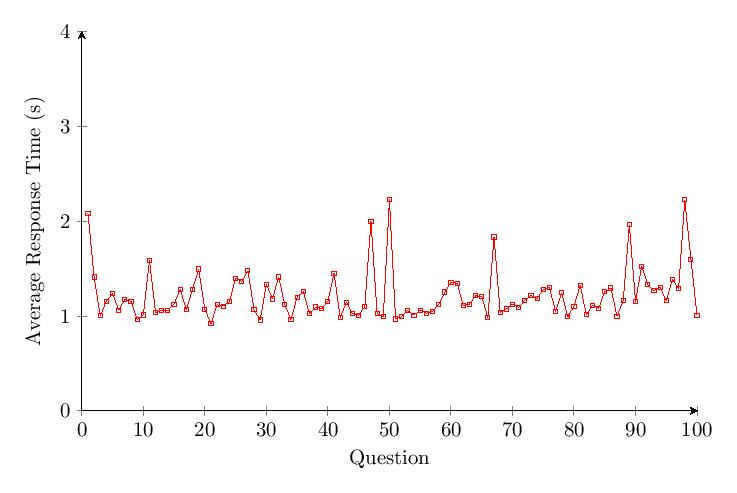
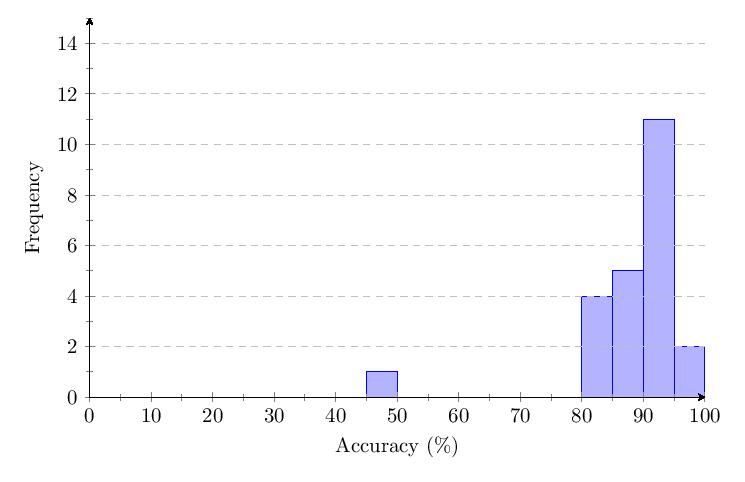
Scores for Category 1 averaged 69.9%. Most scores clump around 50-80% and response times around 1-2 seconds. The score distribution shows a primary peak with 8 scores at 75-80%.
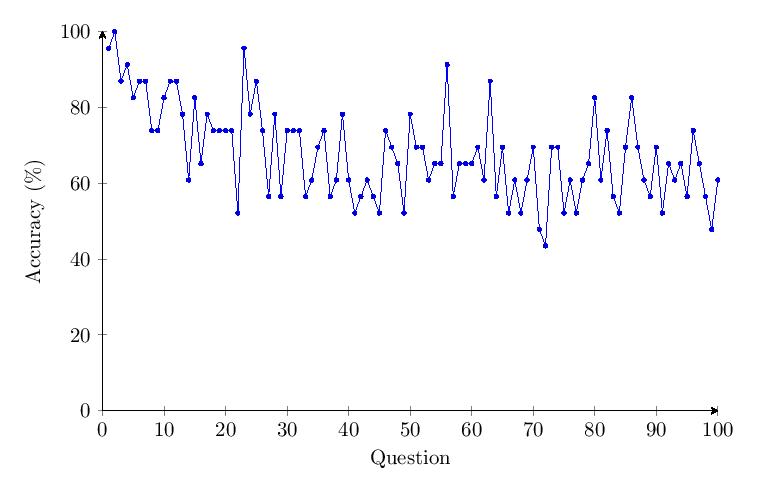
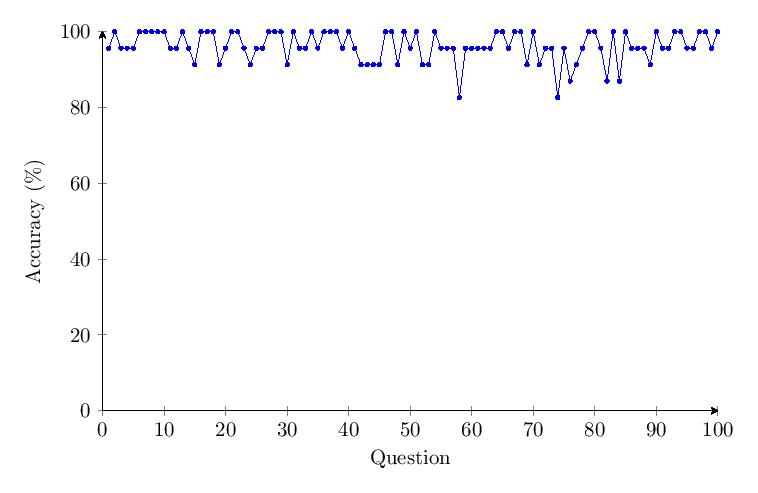
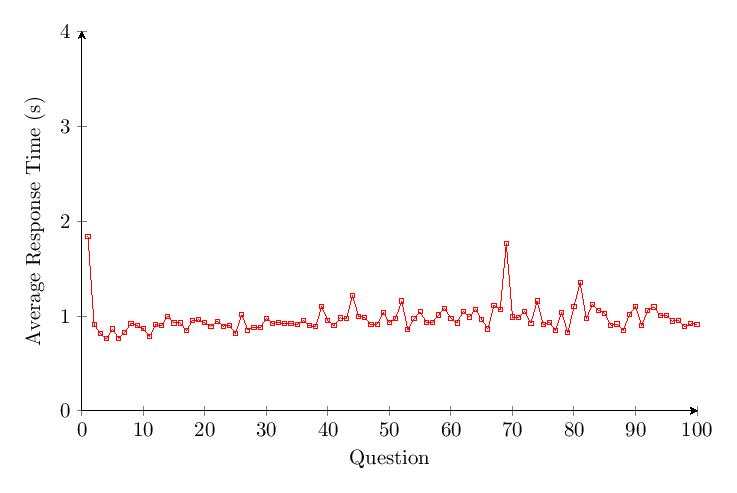
Due to the methodological changes, it was possible to graph the average score per question over time. The data shows a drop of about 50% in accuracy over time for Category 1. There was no noticeable trend or changes over time for response time.
5.4.2 Category 2 Data
Scores for Category 2 averaged 74.6%. Most scores clump around 60-85% and response times around 1-2 seconds. The score distribution shows a primary peak with 8 scores at 75-80%.
The accuracy per question data shows a drop of about 40% in accuracy over time for Category 2. Outliers with response times of over 2 minutes were noted under Questions 41 and 98.
5.4.3 Category 3 Data
Scores for Category 3 averaged 87.7%. Most scores clump around 80-95% and response times around 1-1.5 seconds. The score distribution shows a primary peak with 11 scores at 90-95%.
The data shows a drop of about 20% in accuracy over time for Category 3. An outlier with a response time of around 35 minutes was noted under Question 2.
5.4.4 Category 4 Data
Scores for Category 4 averaged 68%. Most scores clump around 50-85% and response times around 0.5-1.5 seconds. The score distribution shows a primary peak with 7 scores at 70-75%.
The data shows a drop of about 40% in accuracy over time for Category 4. The response time for Category 4 only increases by a small percentage over time.
5.4.5 Category 5 Data
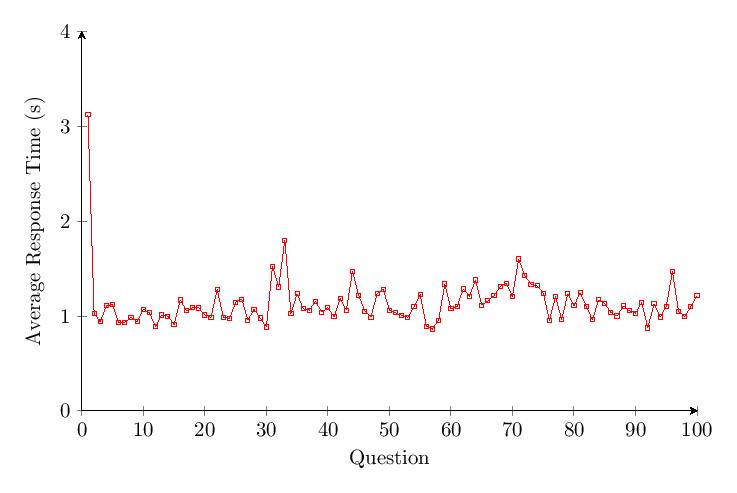
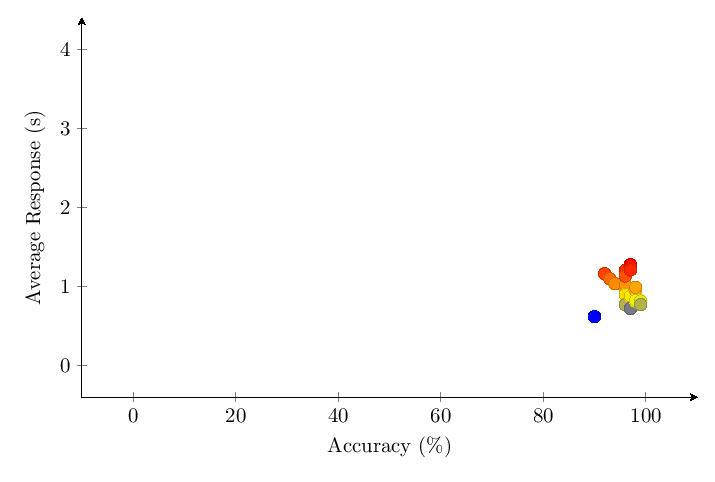
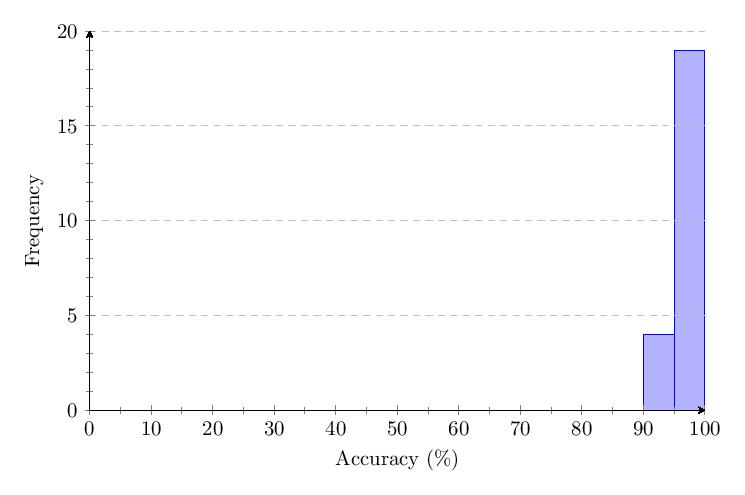
Scores for Category 5 averaged 96.3%. Most scores clump around 90-100% and response times around 1 second. The score distribution shows a primary peak with 7 scores at 95-100%.
Unlike previous categories, the data shows no drop in accuracy over time for Category 5. The response time for Category 5 only increases by a small percentage over time.
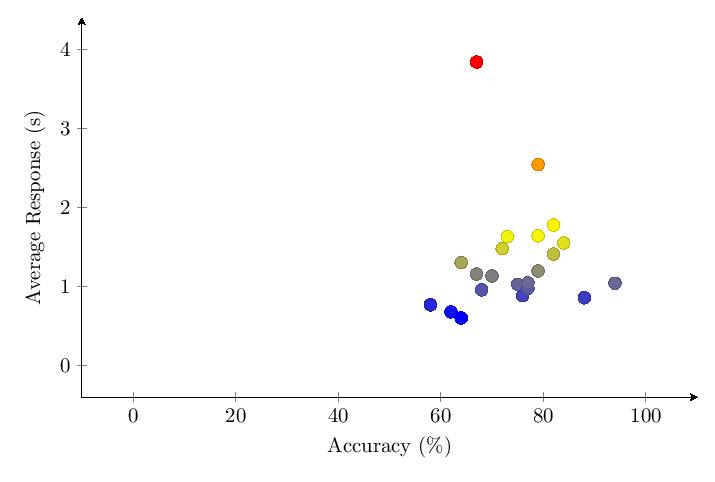
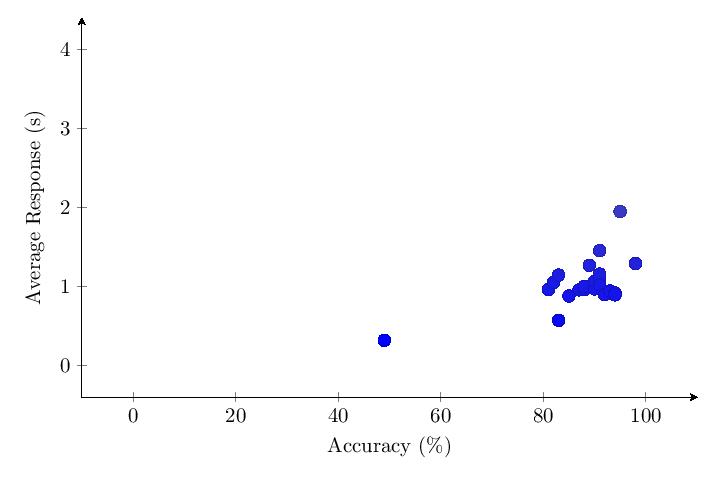
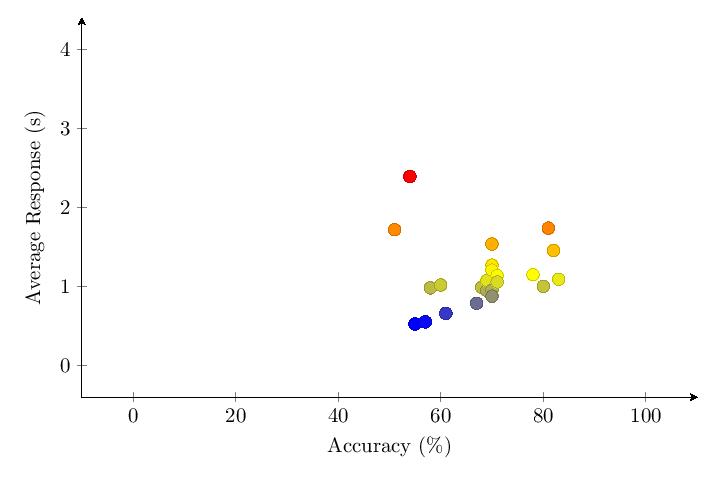
5.4.6 Comparing Categories
The scatter plot and histogram comparing results of the five tested categories in v1.65 confirm the patterns observed in v1.0.
5.5 v1.X Meta-Analysis of Results
For some statistics, it may be of interest if not use to analyze the differences between the results of version 1.0 and version 1.65, as well as to combine both datasets into one to get a larger amount of data to analyze when dealing with calculations or graphing methods that could pay excessive respect to outliers when the pool of total data points is too few.
Combined v1.0 and v1.65 Table of Average Scores:
5.5.1 Category 1 Data
Combined Category 1 scores show most scores clump around 60-90% and response times around 1-2 seconds.
5.5.2 Category 2 Data
Combined Category 2 scores show most scores clump around 60-90% and response times around 1-2 seconds.
5.5.3 Category 3 Data
Combined Category 3 scores show most scores clump around 80-100% and response times around 1-2 seconds.
5.5.4 Category 4 Data
Combined Category 4 scores show most scores clump around 50-85% and response times around 1-2 seconds.
5.5.5 Category 5 Data
Combined Category 5 scores show most scores clump around 90-100% and response times around 1 second.
5.5.6 Category Comparison
The combined scatter plot and histogram comparing results of the five tested categories across both v1.0 and v1.65 provide the most comprehensive view of performance differences across username formats.
5.6 v2.0 (Ongoing)
The version 2.0 of the study is live as of 1 October, 2025, which is the informal publication date of this pre-report. The study platform is being released to the public simultaneous to this pre-report, in the hopes that their simultaneous publication and referencing each other may aid in improving interest in this research project and study.
The changes to v2.0 were selected to improve on and account for the shortcomings in the prior versions without taking too long to develop.
5.6.1 Request for Comment
We held an informal Request for Comment (RfC) to gather community feedback on some proposed changes to the survey, specifically to find new categories to add for further testing, to gather feedback on categories to remove, and to gather feedback on the length of each category in trials.
This RfC resulted in the recommendations to add a category in the format of
Adjective+Noun5.6.2 Decisions of Sprinkler Research Group on v2.0
With aid of the recommendations from the RfC, we decided to make the following changes to v2.0 from v1.65, broadly following the RfC recommendations.
We determined that it was a good idea to add
Adjective+NounWe could not find a practical method to incorporate the color association idea, although we think it holds merit, that wouldn"t double the total test length with re-trials of all categories and without introducing potential confounding, so for this reason it has been excluded. We agree that v2.0 will be able to be more deeply analyzed with longer categories, so we have decided to double the number of trials per category to 200. It is very possible that this will decrease the number of respondents who fill out the entire survey, but the responses that we do get will be more accurate.
The RfC also recommended the removal of Category 1 due to its similarity with Category 4, and we accepted this proposal. We also chose to remove Category 2 due to the insufficient total number of possible usernames (Only 2600 unique names, calculated from 261010) which would not be useful or scalable in real digital environments with an unknown quantity of users.
Additionally, we decided to replace Category 3 with a new category of our own making, due to Category 3"s similarly small total namespace (2400 unique names, calculated from 20620), and its similarity to the concept of this new category. That new category is the output of a custom script running a Markov chain trained on english words, with outputs filtered to ensure that no single result is one letter away from an english word nor two letters away from an inappropriate word. This technique has been demonstrated to produce at least 50,000 unique names, and can likely produce far more, so it is sufficient for the purposes of this survey.
Category 4 was kept in order to have a metric to directly compare to the results of Category 1 and Category 4 from v1.0 and v1.65, even though the total range of possible values is evidently a mere one-thousand. The reason for choosing to keep Category 4 over categories 3 or 1 is simply because we determined Category 4 the most similar to both categories 1 and 4 in versions 1.0 and 1.65, meaning it gives us the largest surface to compare against between study versions for a single category. Finally, to round the number of categories off to a nice and even 5, we added a category that samples from a dataset of 6,864,472 Minecraft usernames in a list online by Yunowe (2022). We checked that every name in this dataset was unique and added it as Category 8.
5.6.3 Final v2.0 spec
The final spec for v2.0 consists of a new category list (note that the categories have non-sequential numerical IDs due to our choice to not discard the older data):
Markov outputScassleAdjective+NounMedium SprinklerMinecraft usernamew4nderlostXXX779NOUNHOUSEIncluding the other non-categorical changes, here is the total summary of changes made to v2.0:
5.6.4 Methodological Improvements
This study could be further improved upon by testing the participant"s long-term memory as well. We chose not to do this to prevent having to force participants to provide de-anonymizing identifying information about themselves. However, there is likely interesting data to be garnered here. It is also worth further study to compare the potential for color associations or avatar appearances to aid in recognition and differentiation of users when there is no visible username, the username itself is color-coded, or when custom colors simply are characters in the username itself.
5.6.5 Category Updates
(Further details to be included in the final report.)
6 Next steps
We refuse to draw conclusions in this pre-report until the data gathering and analysis of 2.0 has been completed. Due to the relatively low sample size and some potential systematic flaws in the study design, we cannot have full confidence that the patterns the data suggests are fully determined by and descriptive of the efficiencies of the underlying models. Readers interested in a more in-depth and data-based conclusion should subscribe to our future research to see our final report.
If any reader has information, questions, or suggestions for us, then such a reader is advised to contact us on Discord @fyrine or @loodledoodles.

